Hand Grip Dynamometer
Instrumentation, circuit design, calibration, and data analysis for a grip‑force tester
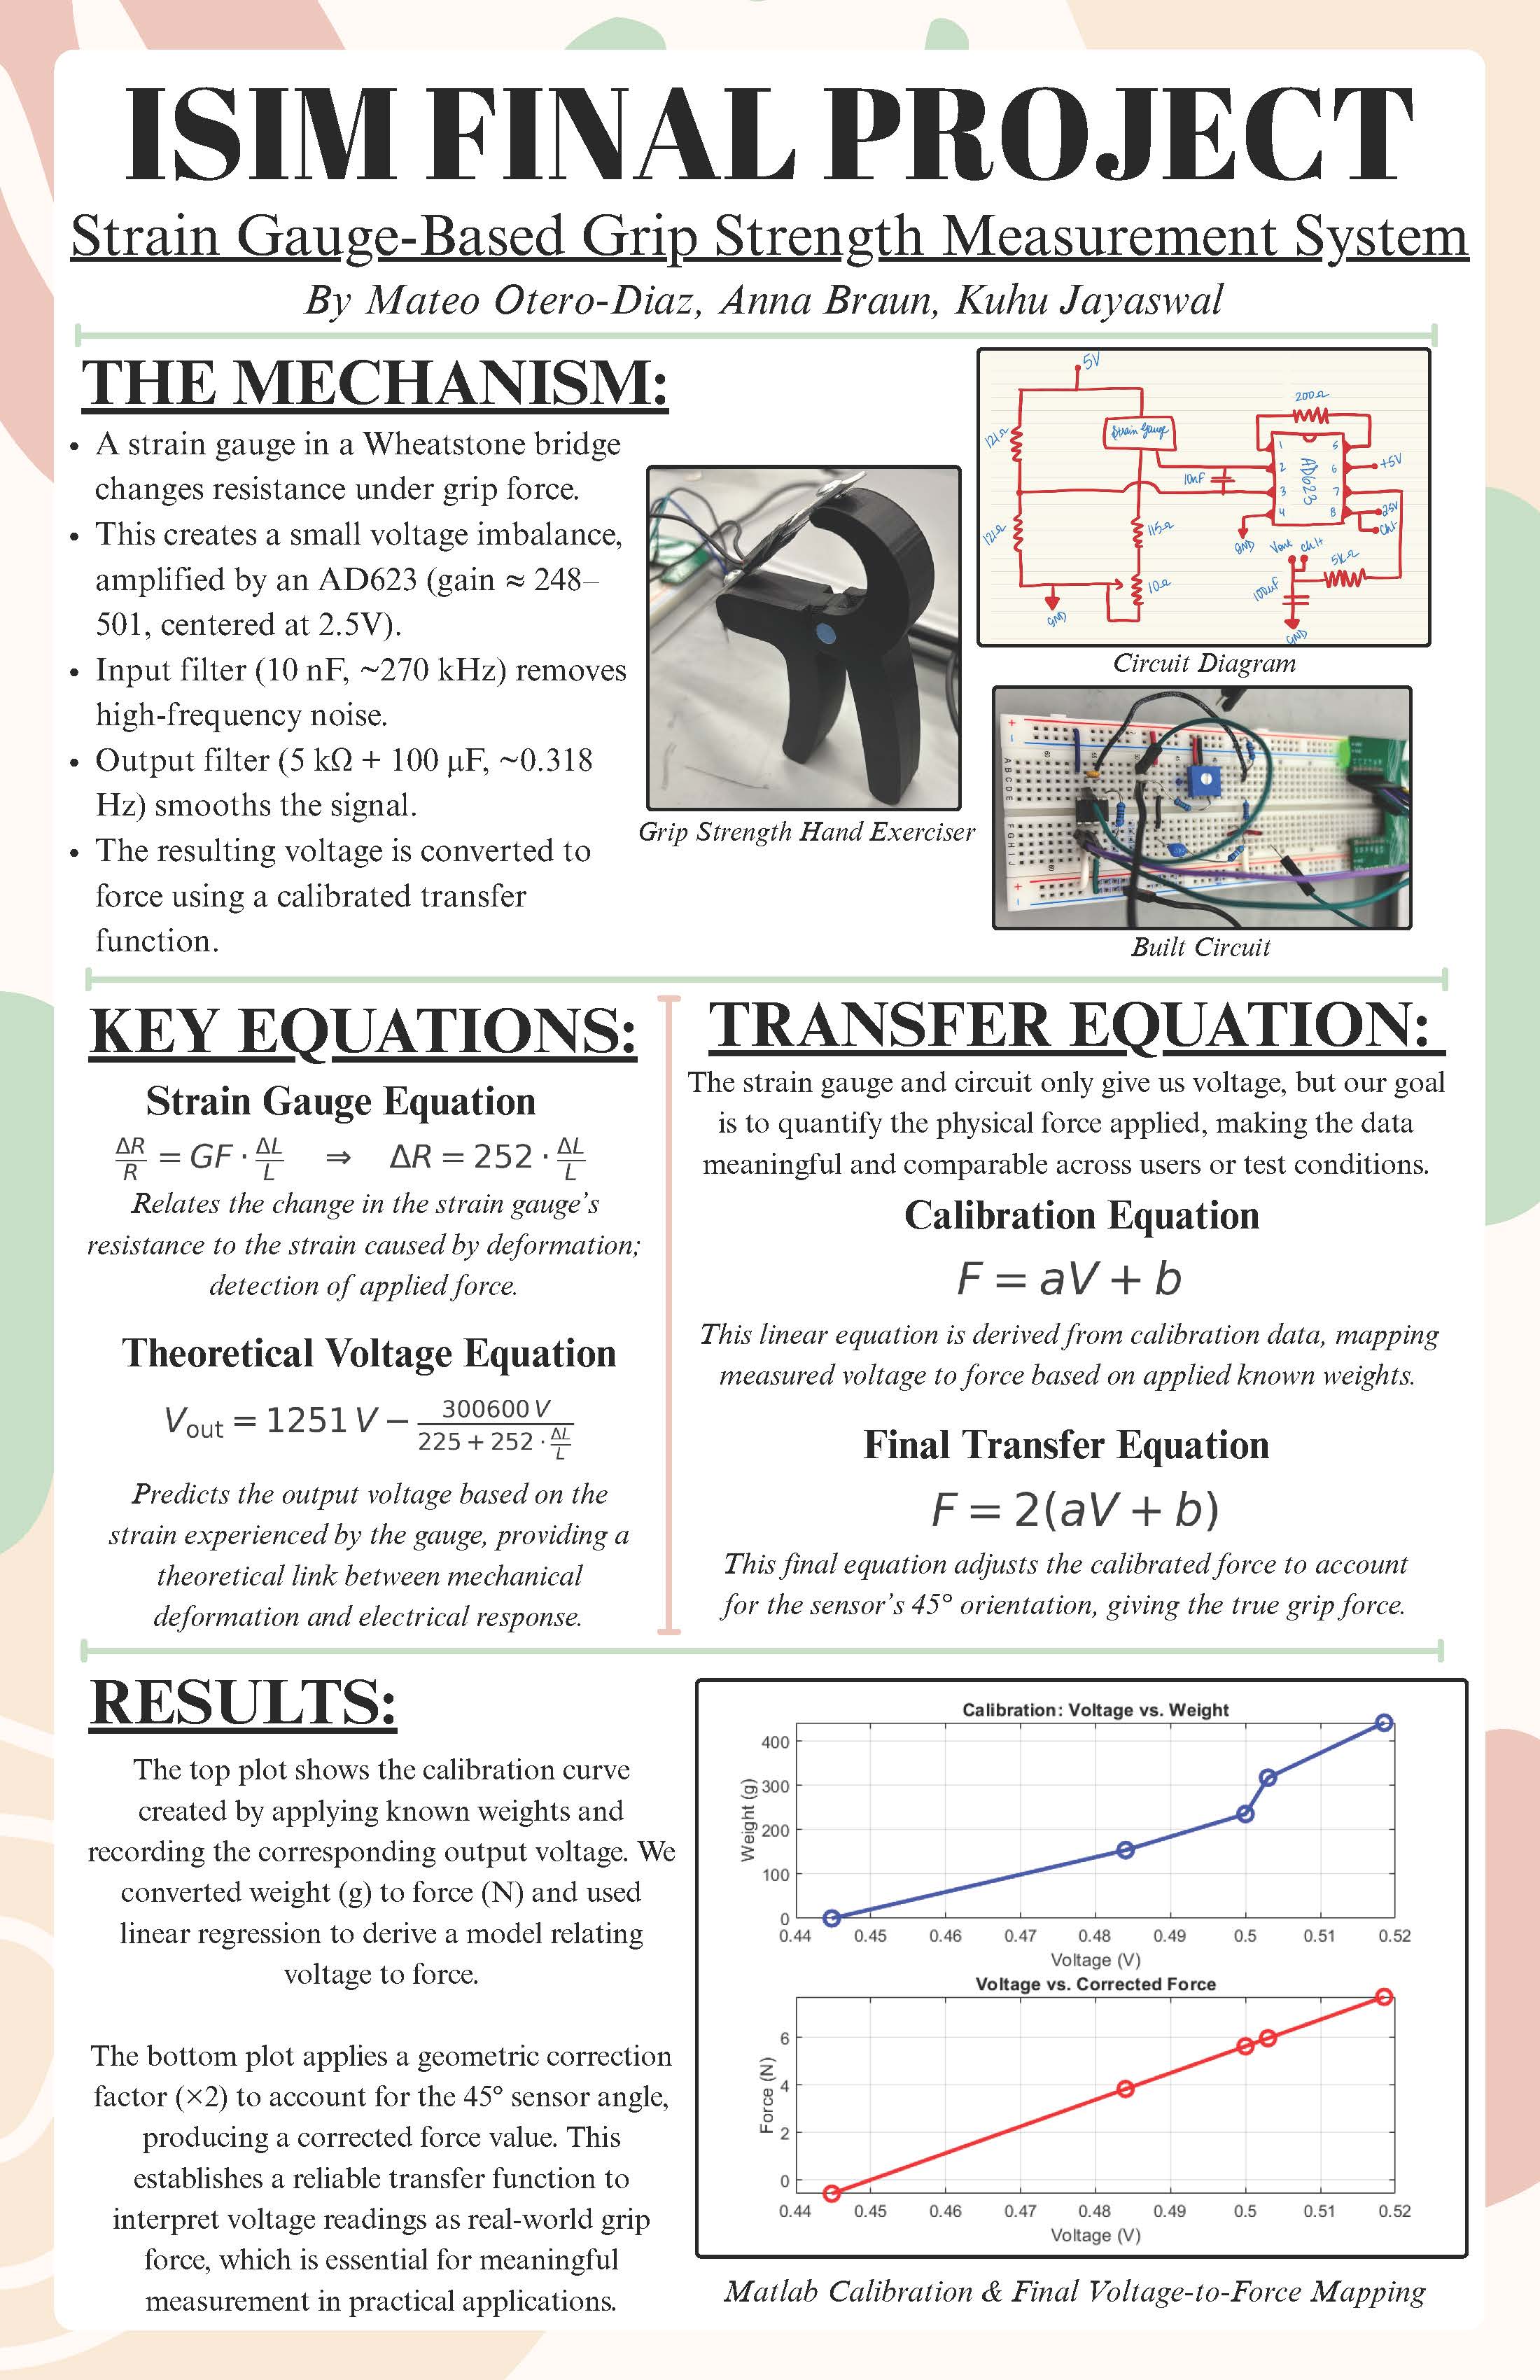
Developed a hand grip dynamometer using a strain (string) gauge in a Wheatstone bridge, an AD623 instrumentation amplifier, and low‑pass filtering to measure grip force with a stable, low‑noise output. The project included circuit design, calibration with known masses, and data analysis in MATLAB.
- Sensing: string gauge (120 Ω nominal, GF ≈ 2.1) in one bridge leg.
- Amplification: AD623 instrumentation amplifier with RF = 200 Ω → gain ≈ 501; Vref = 2.5 V.
- Filtering: input capacitor across differential inputs and an RC output low‑pass for noise suppression.
Theory & circuit
The strain gauge produces a small change in resistance proportional to local strain. The Wheatstone bridge converts resistance change to a differential voltage which is amplified by the AD623. Gain selection follows:
G = 1 + 10 000 / RF (RF = 200 Ω → G ≈ 501)
Vout is referenced to 2.5 V so that positive and negative strain produce readable voltage excursions around mid‑rail. Input and output RC stages reduce high‑frequency noise; the tuned cutoff observed in analysis is ≈ 0.318 Hz for the chosen filter values.
Calibration & data analysis
Calibration was performed by applying known masses, converting to force (F = m/1000 · 9.80665) and recording the corresponding output voltage. A linear regression produced an empirical conversion F = a·V + b, and a geometric correction (sensor at 45°) was applied: the true axial force is F_true = 2·(a·V + b).
Data processing and plots were produced in MATLAB; calibration plots and processed measurements verify linearity and low noise after filtering.
Final measurements
Example measurement: a volunteer produced Vout = 2.92 V. After applying the calibration curve and the 45° correction, the computed grip force was ≈ 277.4 N, consistent with expected ergonomic ranges for the tested cohort.
Tools & methods
- Analog circuit design and prototyping (AD623 instrumentation amp), PCB wiring and bench setup.
- Signal conditioning with passive RC filtering to set a low cutoff and reduce noise.
- Data analysis and plotting in MATLAB; calibration via weighted linear regression.